An epic adaptation of the downfall rant to the capture-mark-recapture world. This was prepared for the retirement symposium of Dr. Jim Nichols, one of the most influential quantitative wildlife ecologists of our times.

 arpat
arpat An epic adaptation of the downfall rant to the capture-mark-recapture world. This was prepared for the retirement symposium of Dr. Jim Nichols, one of the most influential quantitative wildlife ecologists of our times.
… Sam Cruickshank!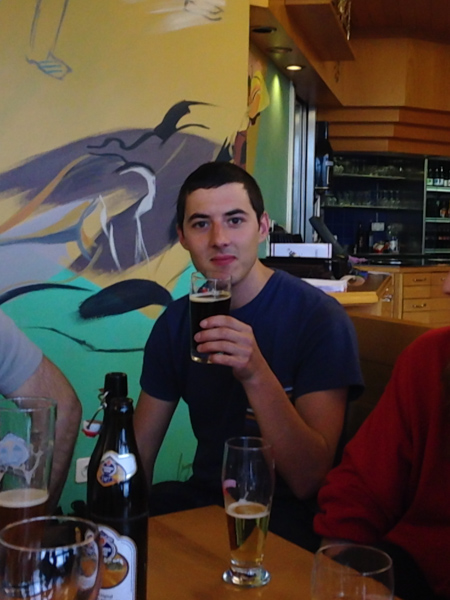
Sam won the prize for the best student talk at the Amphibian Conservation Research Symposium (ACRS) with his talk: ““Testing whether conservation action works: does the creation of stepping-stone ponds increase dispersal?”. Criteria were the style of the presentation, the science and the relevance for real-world conservation.
Big congratulations, Sam!
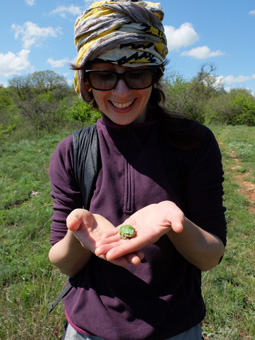 After one year as a SciEx postdoctoral fellow in the population ecology and the amphibian conservation biology groups, Raluca Bancila returns to Romania.
We greatly enjoyed having Raluca as a member of our groups and wish her all the best for her future.
Our collaboration will continue!
I, Mollie, am organizing a workshop here at the University of Zurich. I’ve recruited two experts to come help me teach: Hans Skaug (Dept of Mathematics, Univ of Bergen) and Kasper Kristensen (Dept of Applied Maths and Comp Sci, Technical Univ of Denmark). We’ll teach researchers from diverse fields how to fit state-space models via maximum likelihood estimation using the Laplace approximation to integrate out latent variables and automatic differentiation to calculate gradients. This is much faster than Bayesian methods.
These methods are implemented in AD Model Builder and a new R package called TMB. Currently, the course organizers are trying to decide if we should teach both, or only TMB. There are costs and benefits to being early adopters of new software. For example, several years ago, when the user base of ADMB was expanding beyond fisheries stock assessment, we found several bugs that weren’t exposed until people started trying different types of models and different computational platforms. We don’t want to expose students to these issues. On the other hand, learning one new program (rather than two) in a three day workshop might be preferable for some participants. Plus, most ecologists already use R, so learning the package TMB might be slightly easier for them than learning to use ADMB through the R2admb interface. TMB is more streamlined than ADMB because it had ADMB as an example and took advantage of existing free and open source C++ libraries. Whatever we decide to do, we’ll make sure the class exercises and examples are fully debugged before the workshop. Maybe I’ll use my lab mates’ computers as Guinea pigs.
The course will take place September 1-3, followed by 2 days of developing the TMB package and applications. We still have some openings for participants. Applications are due August 1.
More information can be found at the course website
https://sites.google.com/site/uzhstatespaceworkshop/
The workshop is funded by a GRC Grant from the University of Zurich.
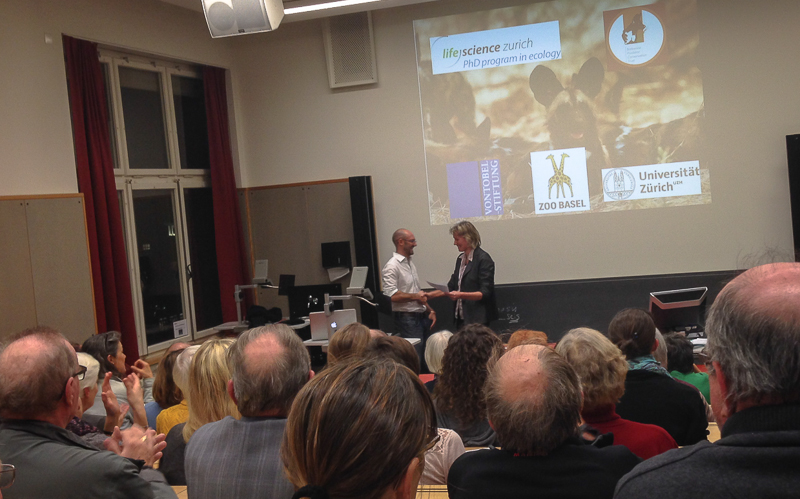
This Tuesday, Dr. Gabriele Cozzi gave a public talk at the Zurich Zoological Society about his PhD work on wild dogs, hyenas and lions in Botswana, and in collaboration with the University of Zurich and the Botswana Predator Conservation Trust :
“Mit Katzen (nicht) kommunizieren: ein Hundeleben”
“In (no) communication with cats: A dog’s life”
At the end of his talk, Gabriele received the prestigious Price for Nature and Environmental Protection (2013) in recognition of his contribution to wildlife conservation in Africa. Congratulations to Gabriele for this well-deserved award!
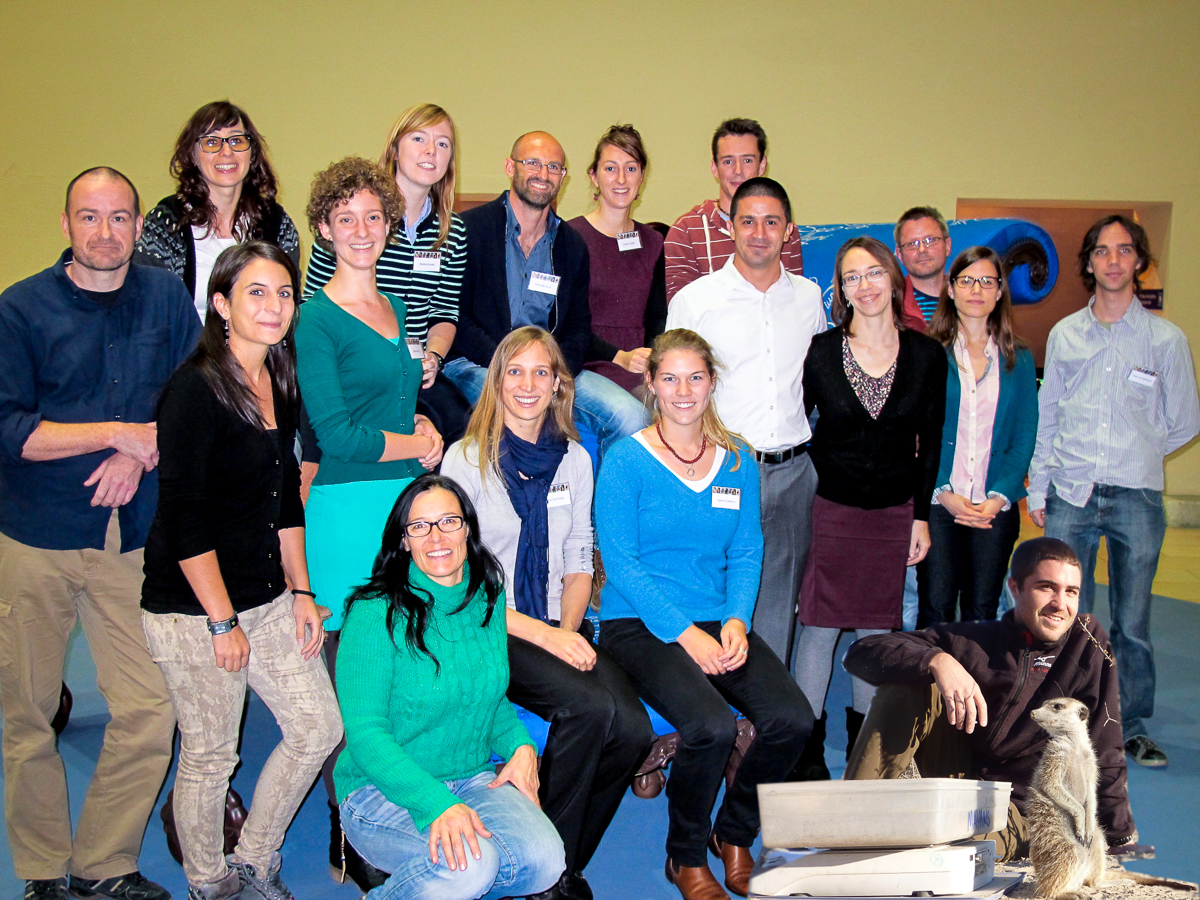
A rare opportunity for a group & affiliates photo. Taken during the apero following my inaugural talk, the reason why I am dressed like a bible salesman.
Here’s a beautiful “studio” shoot of our laboratory’s cover girl, Rotiferella, taken by Stefan using a stereomicroscope. This is a mictic female of Brachionus calyciflorus carrying five male eggs.
http://www.youtube.com/watch?v=PfLJaM4Ekn4
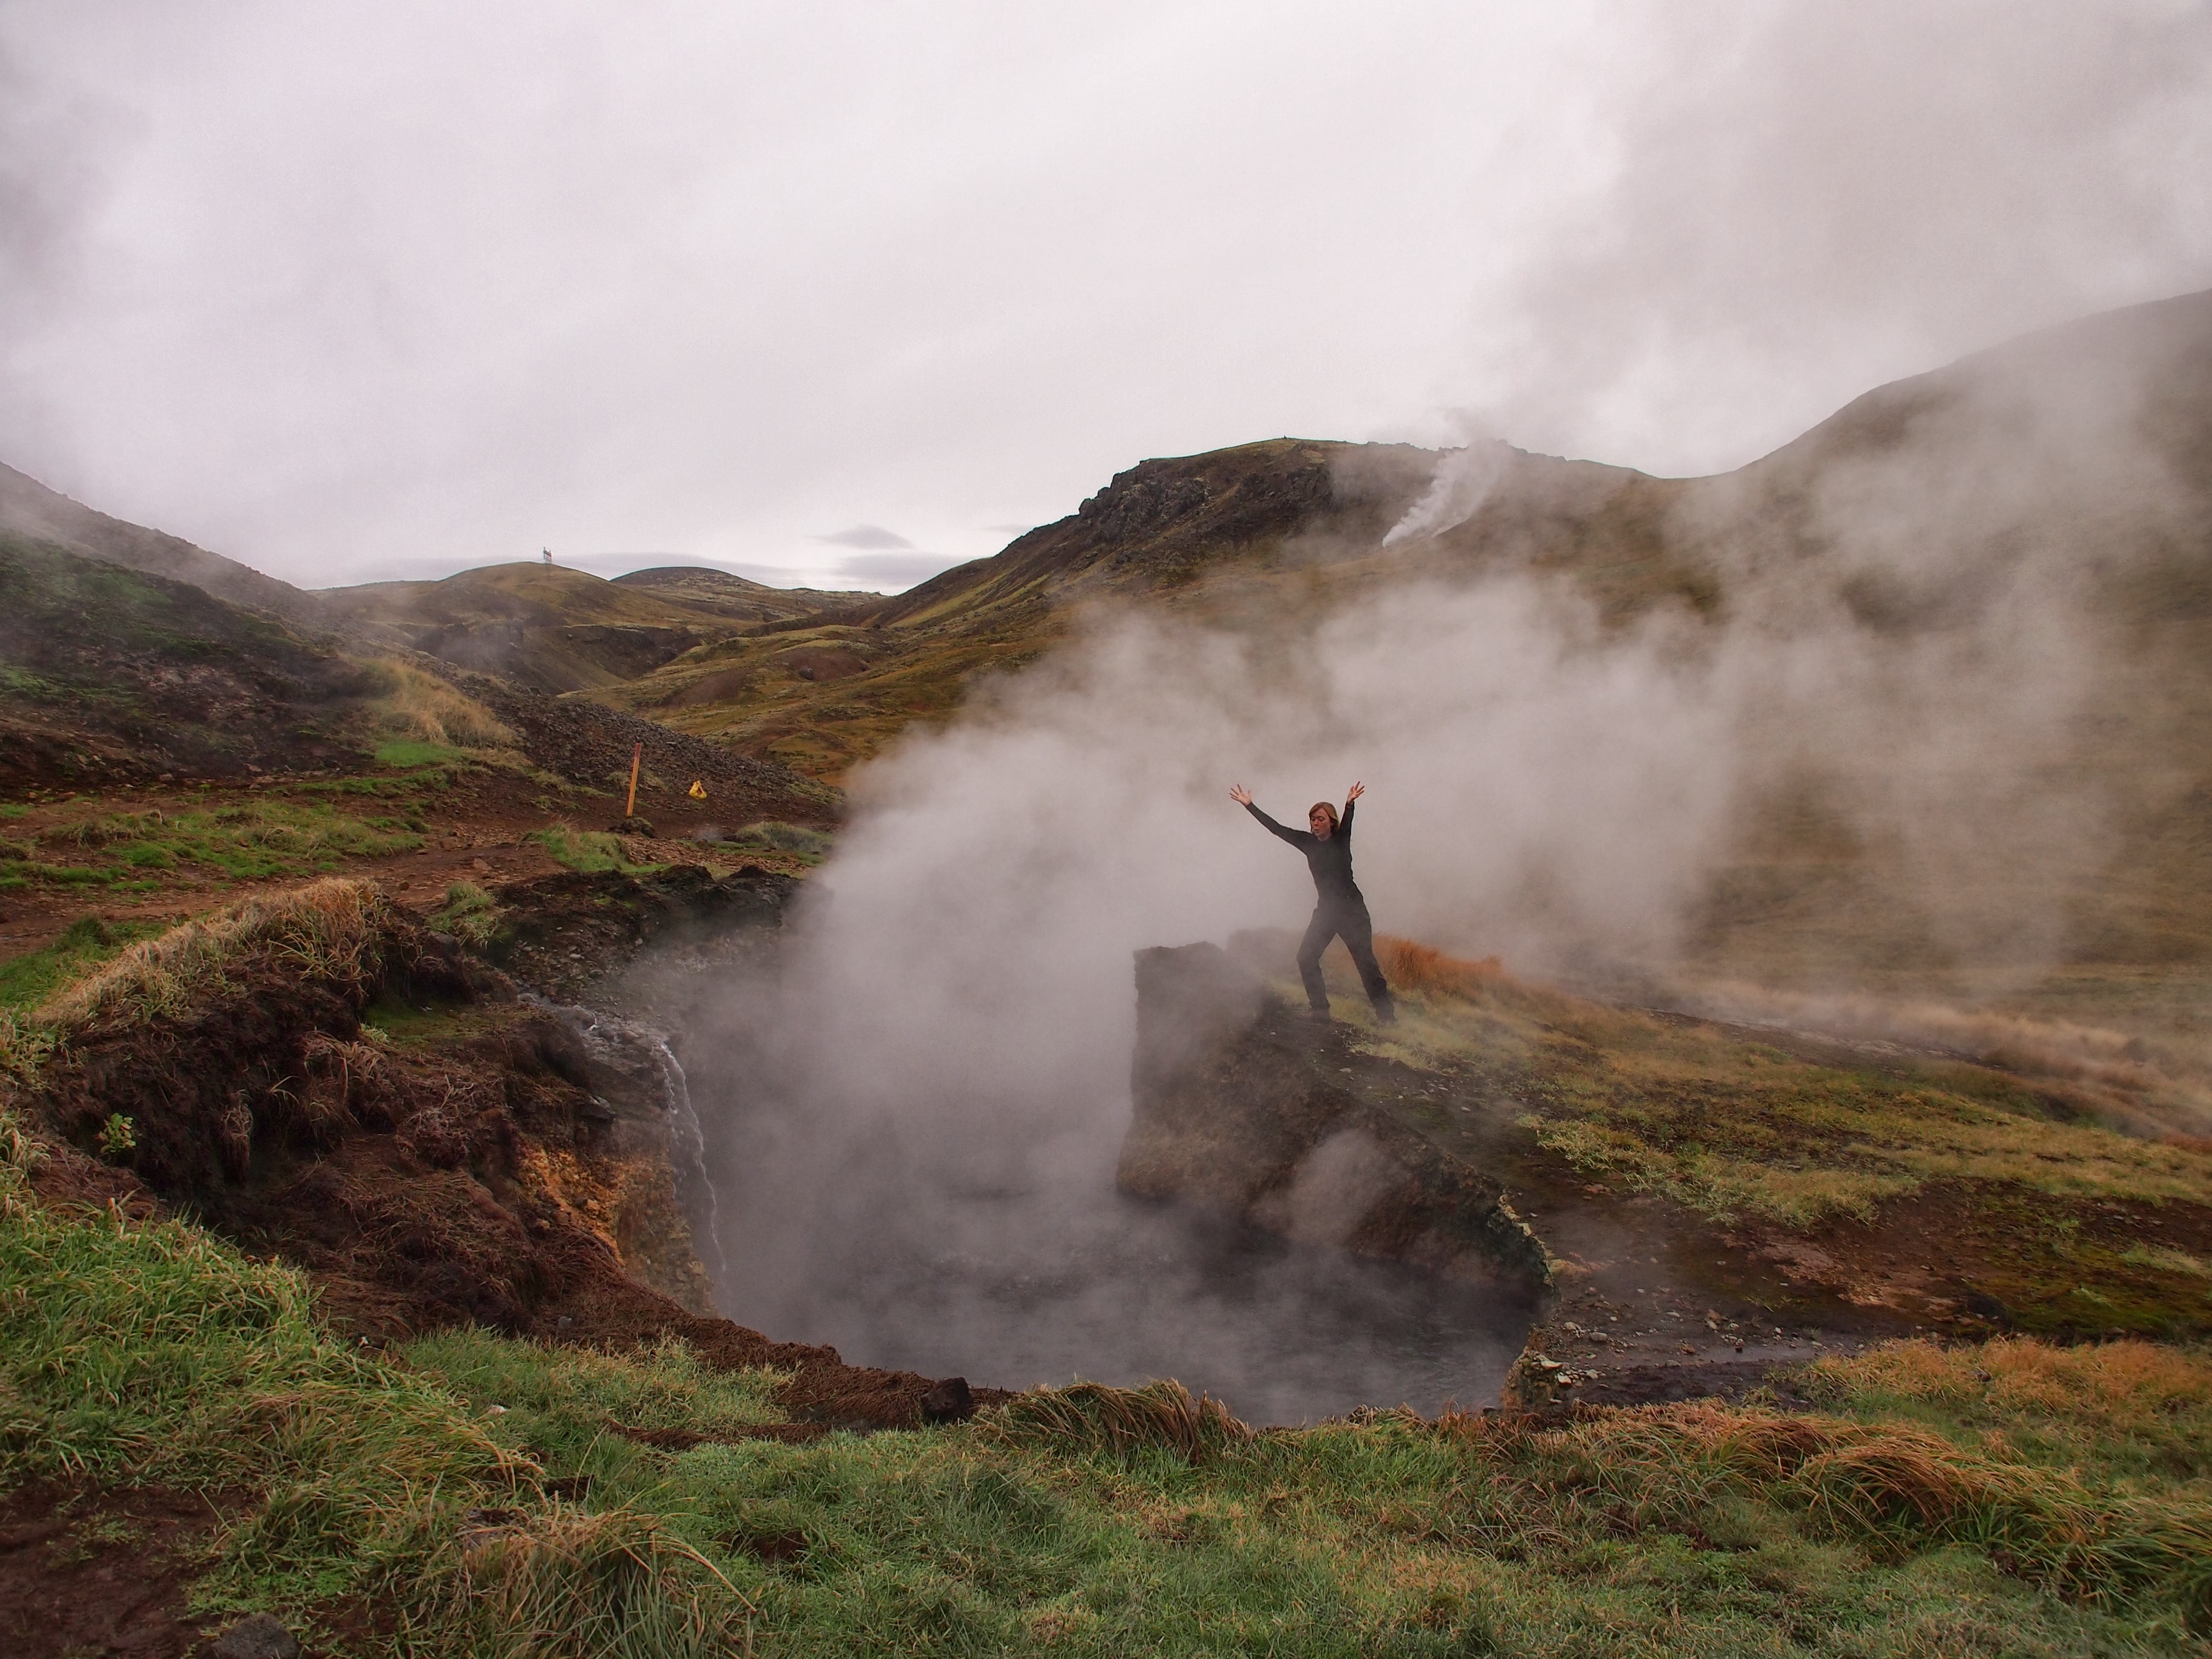
This photo has nothing to do with the workshop. I did some hiking after the workshop and found this huge boiling cauldron of water in the land of fire and ice. The landscapes were amazing with so much geothermal activity, old lava fields, and water falls.
The main purpose of my trip to Iceland was to work September 18-22 with eleven other developers on the statistical software Automatic Differentiation Model Builder (ADMB) at the University of Iceland and the Marine Research Institute in Reykjavik, Iceland. ADMB is useful for fitting nonlinear models and has the flexibility to fit random effects. It’s nearly as flexible as MCMC methods like WinBUGS, but much faster and without the need for specifying prior information (it’s really cool!).
It’s so much easier to get everyone engaged in a discussion and making decisions when we’re all working in the same room, rather than over email when we’re spread out over the corners of the earth. Since we had developers coming from North America and Europe, Iceland was a good midway point, and we had an excellent Icelandic host.
We discussed many important decisions for how to move forward with the software including documentation, parallelization, the most efficient linear algebra libraries, optimizers, links to R, and potentially moving to Github. We’re working to make the documentation easier for new users and writing an introduction aimed especially at R users. We discussed teaching workshops in the near future. We have one scheduled at the International Statistical Ecology Conference and we’re interested in teaching to other groups as well. Let me know if you’re interested.
“What’s evolution got to do with math?” This is an article I wrote (in Turkish) on the mathematical analysis of microevolutionary process, focusing on demography, variation and selection components of the current eco-evolutionary models. It is published in Cumhuriyet Bilim Teknik (1373: 10-11), a popular science magazine in Turkey, and reproduced here with their permission.
∞

Bu soruyu sormadan önce matematiğin doğa bilimleriyle ne alakası olduğunu bir kez daha hatırlayalım. Bilim insanları olarak, doğanın nasıl işlediğine dair gözleme dayalı öngörülerimizi hipotezler halinde paketleyip geçerliliklerini gözlem ve deneyler yoluyla sorguluyoruz. Bu uzun (ve kimine göre sıkıcı) sorgulamanın sonunda tutarlılığını koruyabilen hipotezler, bizim doğa tanımımızın son versiyonunu oluşturuyor. Her ne kadar bazı bilim dallarında bu sorgulamayı nitel (sözel) olarak yapabilsek de, nicel (sayısal) verilerin toplanabildiği ve problemlerin gittikçe karmaşıklaştığı alanlarda, hipotezleri matematiksel ifade edebilmek bu sorgulama sürecini çok daha verimli kılıyor. Yani, kullanılabildiği yerde, matematik etkili bir bilimsel sorgulama diline dönüşüyor. İki kere iki dört…
“Bir gram cebir bir ton sözlü argümana bedeldir” J.B.S. Haldane
Temel bilimlerin her alanında olduğu gibi, evrimsel biyolojide de hipotezlerimizin birçoğunu nicel olarak formüle ediyor, bu sayede bilimsel sorgulama işlemini daha titiz ve objektif hale getirebiliyoruz. Bunu görmek için evrimsel sürecin küçük adımlarının, yani mikroevrimin tanımına bakalım: bir popülasyon içerisindeki genotip ve buna bağlı fenotip dağılımlarındaki değişim. Bu değişim sürecini inceleyebilmek ve altında yatan mekanizmaları anlayabilmek için bu süreci nicel olarak formüle edip sorgulanabilir hipotezlere indirgiyoruz. Her ne kadar araştırmalarımızı bu sürecin belirli aşamalarında detaylı sorulara odaklanarak yapsak da, evrimsel sürecin tamamını matematiksel bir dille ifade edebilir ve bir sistem modeli olarak ele alabiliriz.
Doğal seçilim; mutasyon, göç ve genetik sürüklenmeyle birlikte, evrimin temel mekanizmalarından biridir. İlk kez Darwin’in nitel olarak tanımladığı “doğal seçilim yoluyla evrim” modelini üç ana bileşende inceleyebiliriz: demografi, farklılık ve seçilim modelleri. Sistemin ilk bileşeni, popülasyonu oluşturan bireylerin sayılarındaki değişimi tanımlayan bir demografi modelidir. Bu tür modeller insan ve yaban hayat popülasyonlarını konu edinen araştırmalarda sıklıkla kullanılır. Darwin’in evrim kuramını oluşturmasında da dönemin ekonomistlerinden Malthus’un popülasyon modeli önemli rol oynamıştır. Malthus’un kuramına göre popülasyonlar, aynı banka hesapları gibi anaparanın üzerine faiz* ekleyerek büyür ve bu özellik her popülasyona üssel artış potansiyeli sağlar. Popülasyon büyüklüğü N ve t süredeki büyüme oranı r ise dN/dt = rN. Ancak, kaynakların sınırlı olduğu bir çevrede, popülasyon hızla çevrenin taşıma kapasitesine ulaşır; hem tür içi hem de türler arası rekabet sonucu sağkalım ve üreme oranları azalır, popülasyon büyüme hızı yavaşlar ve durur. Taşıma kapasitesi K ise dN/dt = rN(K-N)/K. Peki, büyüklüğü çevrenin taşıma kapasitesiyle sınırlı bir popülasyondaki şanslı bireyler kimler? Ne tür fenotip özellikleri sayesinde bazı bireyler sağ kalıp üreyebiliyorken, bu özelliklere sahip olmayan şanssız bireyler üremeden yok oluyor?
Bu aşamada, popülasyonu oluşturan bireyler arasındaki fenotip farklılıkları ve bu farklılıkların üreyen bireylerin yavrularına aktarımlarını tanımlayacak bir farklılık modeli kullanıyoruz. Bu model hem fenotipik esneklik gibi ekolojik tepkimeleri, hem de kalıtım ve mutasyon gibi genetik etkileri içerir; belli çevresel koşullar altında belirli genotipteki bireylerin ne tür fenotip özellikleri olacağını tanımlar. Çoğu zaman incelediğimiz fenotip özellikleri, Mendel’in fasulyelerinin aksine, boy gibi nicel özelliklerdir ve belirlenmesinde rol oynayan genlerin sayısı çok olduğundan matematiksel takibi nispeten zordur. Bu durumlarda nesiller arasındaki fenotip dağılım farklılıklarını tanımlamak için nicel genetik (quantitative genetics) yöntemler olarak bilinen, fenotip değerleri ve aile soyağaçlarının istatistiksel analizi üzerine kurulu, biyometrik modeller kullanılır.
Sistem modelimizin üçüncü ve son parçası ise farklı fenotip özelliklerine sahip bireylerin göreceli sağkalım ve üreme becerilerini belirleyen, yani her bireye veya genotipe bir seçilim değeri (fitness) verebildiğimiz seçilim modelidir. Bu seçilim değeri sabit değil, aksine değişen çevre koşullarıyla ve popülasyondaki diğer bireylerle rekabetle sürekli güncellenen dinamik bir değerdir. Seçilim değerlerindeki bu dinamizmi tanımlamak için seçilim gradyanları ve diferansiyelleri kullanılır. Bu denklemler sistem modelimizin kritik parçalarından biridir ve doğru tanımlayabilmek için farklı fenotip özellikleri olan bireylerin farklı çevresel koşullarda sağkalım ve üreme performanslarını ölçebilmek veya öngörebilmek gerekir.
Bu üç ana parçayı – demografi, farklılık ve seçilim modellerini – birleştirdiğimizde oluşan sistem modeliyle sadece popülasyondaki birey sayısının değil aynı zamanda genotip / fenotip dağılımının da zamanla nasıl değiştiğini inceleyebiliriz. Demografi modeli popülasyonun büyüme potansiyelini ve sınırlarını belirlerken, farklılık modeli bireylerin fenotip özelliklerini ve yavrulara aktarımını tanımlar; seçilim modeli ise hangi bireylerin veya fenotip farklılıklarının bu rekabetten kazançlı çıkacağını belirler, yani bir sonraki nesilde popülasyonu oluşturacak yeni bireyleri seçer. Bu “geridönüşümlü” dinamik mikroevrim modelini kullanarak hangi özelliklerin zaman içerisinde rekabeti kazanıp popülasyonda sabitleneceğini öngörebiliriz. Bu tür “evrimsel sabit stratejileri” (ESS) belirlemek içinse ilk olarak John von Neumann tarafından geliştirilen ve evrimsel uygulamalarını John Maynard Smith’in başlattığı Oyun Kuramı metodları kullanılır. Bu matematiksel yöntemler sayesinde, ilk bakışta evrime aykırı gibi görünen fedakarlık (altruizm) gibi davranışların aslında nasıl evrimsel açıdan kalıcı stratejiler olabileceğini anlıyoruz.
Özetle, matematiksel evrimi şöyle tanımlayabiliriz: bir popülasyon içerisindeki genotip ve fenotip dağılımlarında zaman içerisinde görülen değişimin matematiksel ve istatistiksel yöntemler kullanarak nicel incelemesi. Tabii ki, evrimsel biyolojide kullanılan matematiksel ve istatistiksel yöntemler yukarıda belirtilen mikroevrim sürecini incelemekle sınırlı değildir. Bu yöntemler makroevrim analizlerinde kullanılan türleşme modelleri, farklı türlerin DNA dizilerinin kıyaslanması, filogenetik ağaç oluşturma yöntemleri, genotip-fenotip haritalaması ve nicel biyolojik verilerin toplanabildiği daha bir çok farklı alanda sıkça kullanılmaktadır. Eylül ayında Şirince’de düzenlediğimiz yaz okulunda evrimsel biyolojinin farklı alanlarında uzmanlaşmış bilim insanları olarak, araştırmalarımızda kullandığımız matematiksel ve istatistiksel yöntemleri lisansüstü öğrencilere ve akademisyenlere tanıtmayı, bu sayede Türkiye’de evrimsel biyoloji alanında bilimsel potansiyeli geliştirmeyi hedefliyoruz. Matematiksel Evrim Yaz Okulu’yla ilgili daha fazla bilgi için: matematikselevrim.org
* Aynı zamanda “çıkar” anlamına da gelen İngilizce “interest” kelimesinin doğru çevirisidir!
Burak Avcı ve Tüzer Kalkan’a titiz redaksiyonları için teşekkürler.
I received an interesting email from a geologist, also a close family friend. While researching for a road project at the Kazakhstan-China border, he became curious about the peculiar landscape patterns he came across on Google Earth. These are a battery of colluvial spots, each about 30m wide, distributed homogeneously across a gently sloping ground of loose material. He, an excellent field geologist, couldn’t ascribe these to any geomorphological origin, and became genuinely curious if this could be the habitat use pattern of a “groundhog-like” burrow dwelling creature.
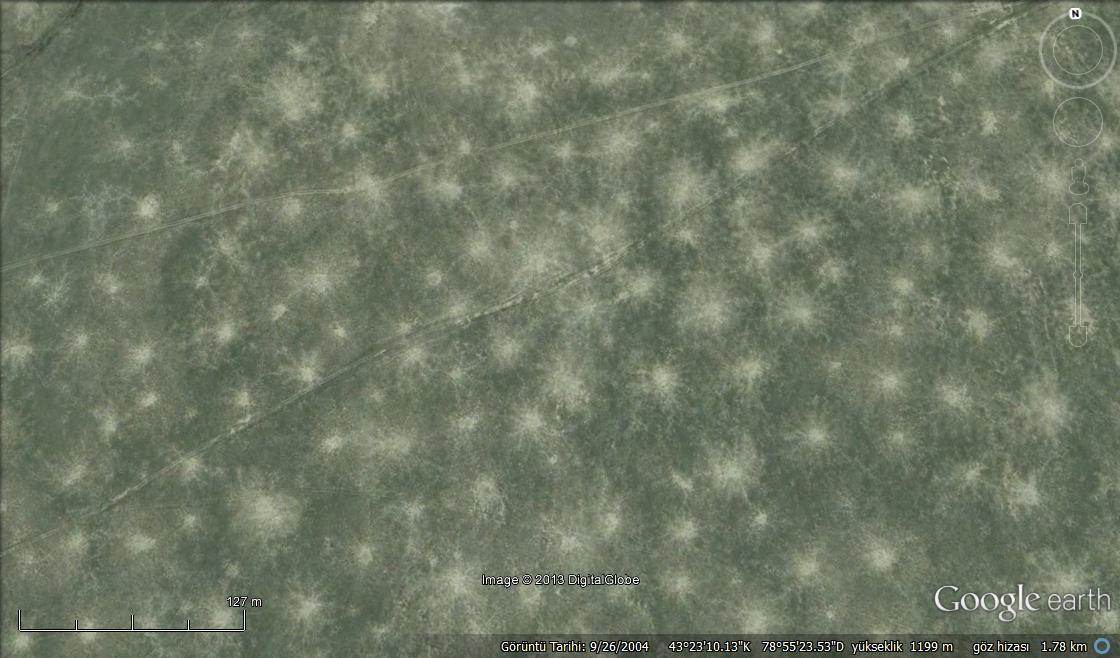
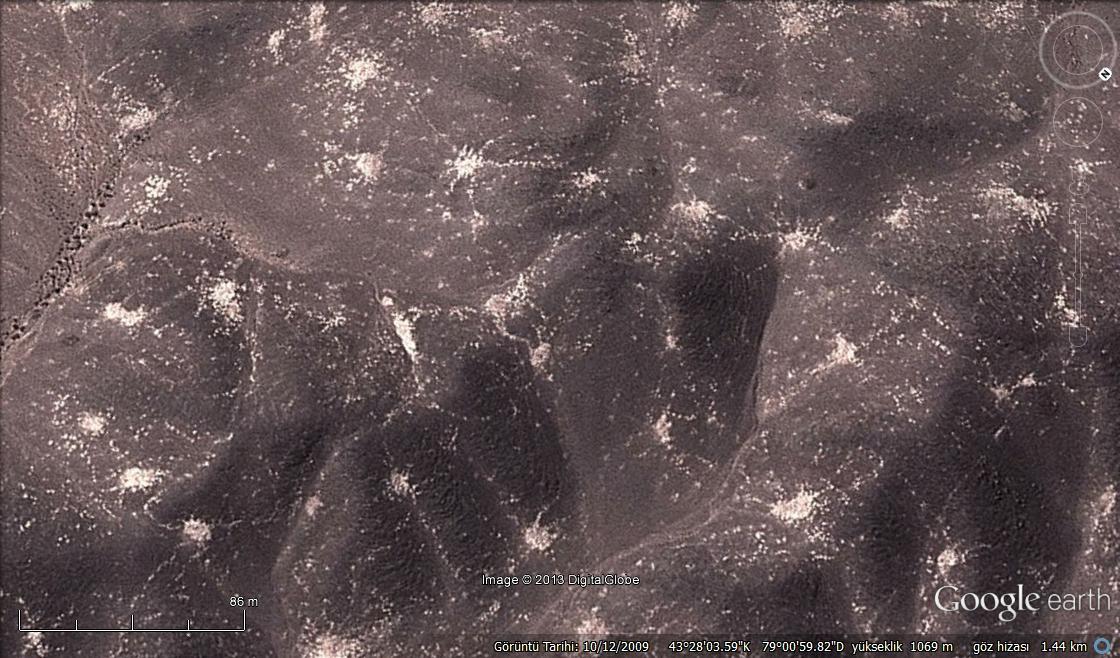
The density of the spots is truly peculiar and unlike those of the three marmot species I am familiar with. The area may host Altai/gray, Bobak, and Menzbier’s marmots, and about eight other ground squirrel species. After a quick search, I came across this website, where they describe the ‘historical’ densities of the Altai marmot as “in an area of about 25 thousand km2 lived approximately 3 million animals, 30-50 families of marmots per km-square… families graze close together, slowly moving around the site, no more than 30-40m from the hole.”
The above description kind of matched the observed pattern, but the density of the spots seemed too high and the radius too small. Maybe, it’s a smaller ground squirrel with higher population growth rates and smaller foraging habitat requirement? Infected by the curiosity of this geologist, I posted this on Facebook. Dr. Rich Grenyer, from Oxford School of Geography, responded indicating that Panoramio photo shots from Google Earth may give some clues, and to our pleasant surprise, among dozen photos of a barren steppe from that exact location, there was also this one:
 First, I thought it was a baby marmot, but the pointed nose and ears gave away the species after a bit of search: the Great Gerbil, Rhombomys opimus. Well then, can this be the culprit causing these patterns? Smaller than the marmots, burrow-dwelling, capable of reaching extreme densities, and wiki says “burrow system complexes have a distinctive region of cleared soil and can be easily seen in aerial photos“.
Someone even studied the plague dynamics in this species using aerial photos. Here’s a figure from their paper showing exactly the same formation:

Case closed! Curiosity won!